https://learn.ni.com/learn/article/labview-tutorial
LabVIEW programs are called virtual instruments, or VIs, because their appearance and operation often imitate physical instruments, such as oscilloscopes and multimeters. LabVIEW contains a comprehensive set of tools for acquiring, analyzing, displaying, and storing data, as well as tools to help you troubleshoot the code you write.
When you create a new VI, you see two windows: the front panel and the block diagram. The front panel is the user interface for the VI, and the block diagram contains the graphical source code of the LabVIEW program.
1. LabView Front Panel
The front panel window is the user interface for the VI. You create the user interface of a VI by placing controls and indicators on its front panel. Controls define inputs, and indicators display outputs.
When you interact with a front panel as a user interface, you can modify controls to supply inputs and see the results in indicators. You can also use the front panel to pass inputs and receive outputs when you call your VI from the block diagram of a different VI.
Controls Palette
The Controls palette contains the controls and indicators you use to create the front panel. You access the Controls palette from the front panel window by selecting View » Controls Palette or by right-clicking on any empty space in the front panel window.
After opening the Controls palette, place controls and indicators on the front panel by clicking on icons from the palettes. Then, click on the front panel where you would like the control or indicator to be placed.
Controls and Indicators
Controls simulate instrument input devices and supply data to the block diagram of the VI. They are typically knobs, push buttons, dials, sliders, and strings.
Indicators simulate instrument output devices and display data the block diagram acquires or generates. They are typically graphs, charts, LEDs, and status strings.
2. LabVIEW Block Diagram
After you create the front panel window, you add code to the LabVIEW block diagram using graphical representations of functions to complete calculations and control the front panel objects. To bring up the block diagram, select Window » Show Block Diagram from the menu bar. Additionally, you can toggle between the block diagram and the front panel by pressing <Ctrl-E>.
Block diagram objects include terminals, subVIs, functions, constants, structures, and wires, which transfer data among other block diagram objects.
Terminals
Front panel objects appear as terminals on the block diagram. Terminals on the block diagram reflect the changes made to their corresponding front panel objects and vice versa.
Terminals are entry and exit ports that exchange information between the front panel and block diagram. They are analogous to parameters and constants in text-based programming languages.
Constants
In addition to controls and indicators, you can have constants on the block diagram for static values needed in your code. You can have constants for any data type.
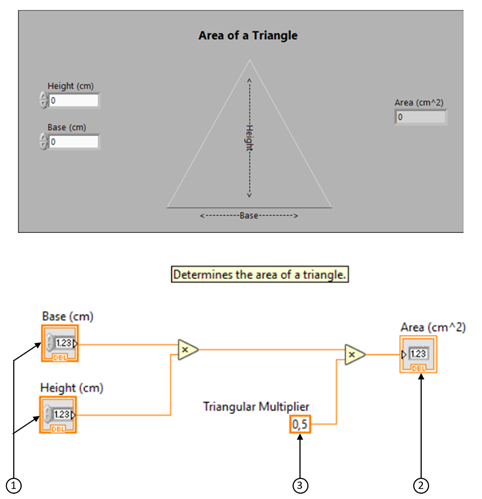
Consider an algorithm for computing the area of a triangle. You might have the following front panel and corresponding block diagram.
The constant Triangular Multiplier does not appear on the front panel window. It simply passes the value of .5 into the multiply function.
Notice that the Base(cm) and Height(cm) block diagram terminals look different from the Area(cm^2) terminal.
There are two distinguishing characteristics between a control and an indicator on the block diagram. The first is an arrow on the terminal that indicates the direction of data flow. The controls have arrows showing the data leaving the terminal, whereas the indicator has an arrow showing the data entering the terminal. The second distinguishing characteristic is the border around the terminal. Controls have a thick border, and indicators have a thin border.
Block Diagram Nodes
Nodes are objects on the block diagram with inputs and/or outputs and perform operations when a VI runs. They are analogous to statements, operators, functions, and subroutines in text-based programming languages. Nodes can be functions, subVIs, or structures. Structures are process control elements, such as case structures, for loops, or while loops.
Functions
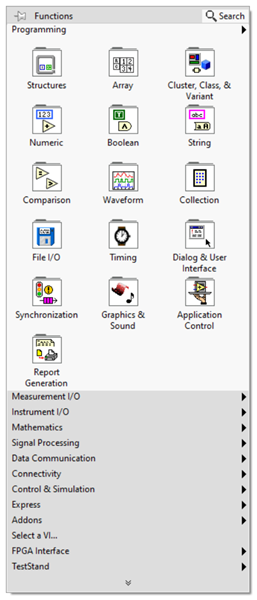
To place objects on the block diagram, simply drag and drop them from the Functions palette. The Functions palette automatically appears when you right-click anywhere on the block diagram workspace. It contains functions, constants, structures, and some subVIs.
The Search button on the Functions palette opens a search dialog box that you can use to search for functions by name. It takes a few moments to launch.
After you see the function you want, double-click it, and LabVIEW jumps to the place on the Functions palette where you can find it.
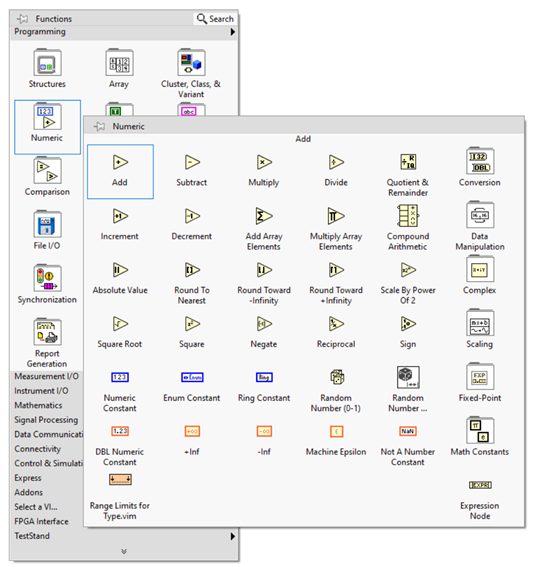
Functions are the fundamental operating elements of LabVIEW. Functions do not have front panel windows or block diagram windows, but they have input and output terminals for passing data in and out, similar to controls and indicators. You can tell if a block diagram object is a function by the pale-yellow background on its icon. The Functions palette has functions arranged in groups based on the type of function they perform. For example, you can look in the Numeric subpalette for functions that perform numeric operations.
3. Example Application
Using the information we have learned thus far, we can build a program to calculate the area of a triangle. We will start by creating the block diagram below.
Open a blank VI from the toolbar. Select File » New VI.
Put two multiply functions on the block diagram by dragging them onto the block diagram from the Programming >> Numeric subpalette.
Tip: To copy an object on the block diagram, hold down while you click and drag the object.
Hover your mouse over the left-most multiply function to make the input and output terminals appear.
If you hold your mouse over one of the terminals, the wire spool appears along with the name of the terminal you are hovering over.
To create a control for the y terminal, simply hover your mouse over it and right-click. Do the same for the x terminal on the left-most multiply function so that you have control for each input terminal.
Wire the output terminal of the left multiply function to the x input of the right multiply function by hovering your mouse over the output terminal. When it turns into the wiring spool, click and hold while you drag the wire to the desired input.
Create the Triangular Multiplier constant .5 by right-clicking on the y input terminal of the right-most multiply function and selecting Create » Constant. You can change the value of a constant by double-clicking it to highlight the text and typing in the new value. Type in .5 and press <enter>.
Right-click the output of the right multiply function and select Create » Indicator to create an indicator that passes the value of the block diagram logic to the front panel.
Tip: You can comment on the block diagram or the front panel by double-clicking the block diagram and typing your comment into the automatically created text box.
You can change the names of indicators, controls, and constants by double-clicking the label and typing the desired name. If no label is shown, right-click the desired object and select Visible Items » Label.
Look at the front panel that was generated from your work on the block diagram by pressing <Ctrl+E> or selecting Window»Show Front Panel. Notice that the two controls Base(cm) and Height(cm) and the indicator Area(cm^2) were automatically generated and placed on the front panel.
On the block diagram, select a While Loop from the Programming >> Structures subpalette. To add the While Loop to your block diagram, left-click and drag the mouse until your code is contained within the loop
In the bottom right corner of the while loop is the Conditional Terminal. Add a Stop button by right-clicking the terminal and selecting Create Control. The button created is automatically displayed on the front panel.
Inside the While Loop, add a Wait (ms) function from the Programming >> Timing subpalette. Right-click on the milliseconds to wait terminal on the left and select Create Constant. Specify how often you would like the while loop to run, like every 500 ms.
The Wait (ms) function controls how often a loop executes, allowing time for the processor to complete other tasks, such as updating and responding to the user interface. If you do not configure loop timing, a while loop will continuously execute and not relinquish the processor to other tasks.
Click the Run button on the VI you just created and change the values on the front panel. Watch how changing the control values of a and b updates the indicator value of a*b.
Click the Stop button to stop the VI. Save and close the VI by selecting File » Save from the menu bar and then clicking the Close button in the top right corner of the front panel window.


